Fixed Range Volume Profile in Backtesting: A Practical Workflow (2026)
How to use a fixed range volume profile while backtesting to test entries around the point of control and value area, why binning from base data matters, and the future-leak trap that quietly fakes your results.
Table of contents
Most traders discover volume profile as a live-trading indicator, drop it on the chart, and hope the levels help. Backtesting flips that around: instead of hoping, you replay historical price and measure whether entries around the point of control and value area actually improved your results. That is the difference between believing volume profile works and knowing whether it works for your strategy.
This guide covers the practical workflow: which type of profile to use, the two accuracy traps that quietly fake your numbers, and a step-by-step process for testing setups around volume levels during a bar-replay session.
If you're new to the terms POC, VAH, VAL, and volume nodes, read volume profile explained first, then come back here for the testing workflow. Still deciding which platform to run this on? The best backtester with volume profile in 2026 compares TradingView, Forex Tester, MT4/MT5, and TradingSFX side by side. The TradingSFX one is the chart replay backtester.
Why Volume Profile Belongs in Backtesting
A backtest without context zones tests entries in a vacuum. You know your setup fired, but not whether it fired somewhere the market actually cared about. Volume profile supplies that context: it tells you whether your entry landed at the point of control, at the edge of value, in a low volume node the market rips through, or in dead space.
That extra dimension is where a lot of edge hides. Two traders can run the identical setup and get different results because one keeps taking it into a high volume node where price stalls, and the other keeps taking it through a low volume node where price runs. You only find that out by testing the setup with the profile on the chart and segmenting the results by where the entry sat.
Fixed Range Is the Right Tool for Replay
Volume profile comes in a few forms, but for backtesting one fits cleanly:
- Visible range rebuilds from whatever candles are on screen. Every time you pan or zoom during replay, the levels move. Useless for studying a fixed level.
- Session / auto profiles redraw per day or week automatically. Fine for a live dashboard, awkward when you want to interrogate one specific swing.
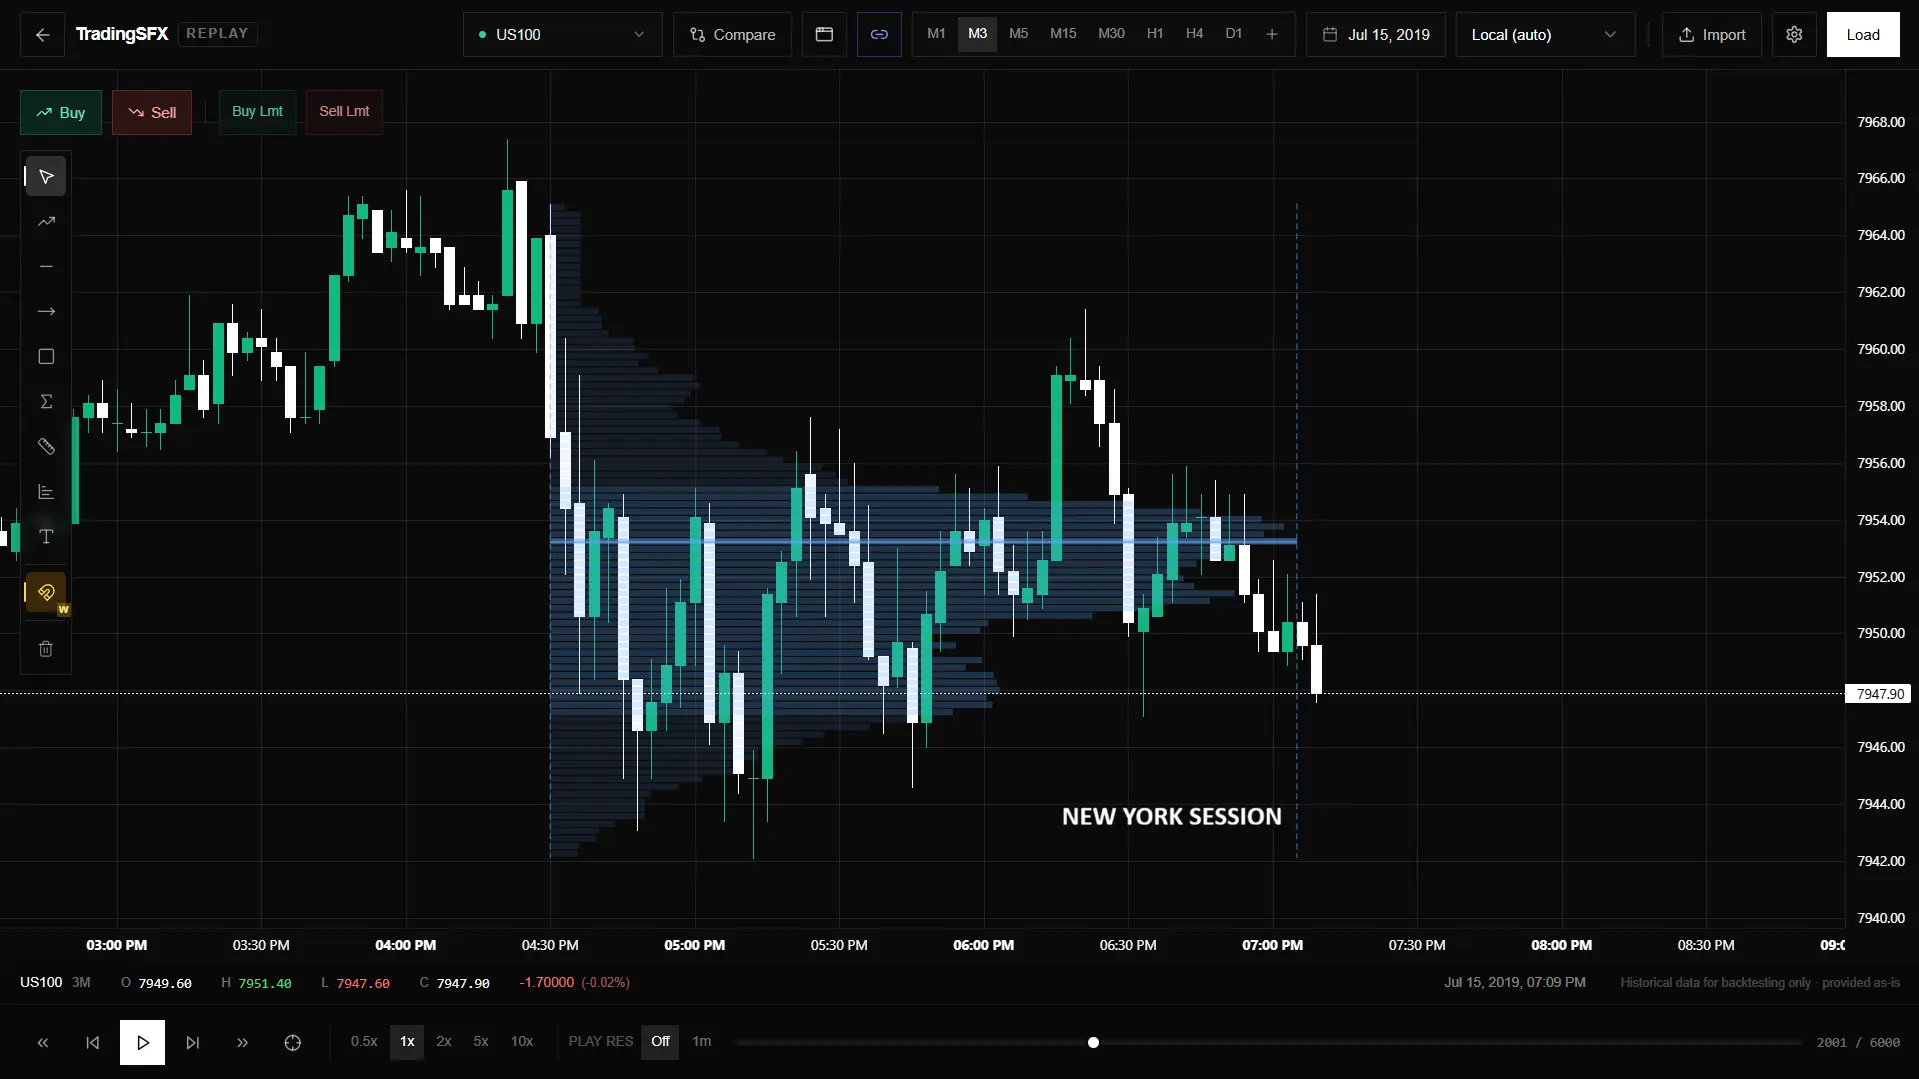
- Fixed range is built from a window you mark by hand and stays anchored. The POC you find over Tuesday's London session stays exactly where you put it while you play Wednesday forward and watch price react to it.
For deliberate testing, fixed range wins because the level holds still. You mark the range that built it, then you get to watch, uninterrupted, whether price respects it.
Two Accuracy Traps That Fake Your Results
Before the workflow, two things quietly ruin volume profile backtests. Getting them right is what separates a real test from a comforting illusion.
Trap 1: Binning from display candles instead of base data
A profile distributes each candle's volume across price. The question is which candles it uses. If it uses the timeframe you're looking at, the profile gets coarse the moment you go higher: an H1 candle only knows its own total volume and its own high and low, so the tool has to smear that volume evenly across a big range. The POC lands in roughly the right zone, but the fine structure, the exact level, the sharp low volume nodes, gets blurred away.
The accurate approach builds the profile from the base data you imported (say, 1-minute bars) no matter what timeframe you're viewing. Each minute's volume is placed at its own tight price range, then summed into the histogram. The result is precise on any display timeframe, because the distribution always uses the finest resolution available. This is how TradingView builds its profiles, and it's the standard worth holding a backtesting tool to.
The practical takeaway: if you import 1-minute data, your profile should look just as sharp on the 1-hour chart as on the 1-minute chart. If it turns into a blurry blob when you zoom out, it's binning from display candles, and the levels you're testing against are approximations of approximations.
Trap 2: Future volume leaking into the profile
This one is subtle and it silently invalidates results. In a replay, you've only "seen" candles up to the current bar. If the profile counts volume from candles that haven't been revealed yet, it's showing you a level built from the future. Your entry looks brilliant because the POC it bounced off was shaped partly by the very move you're trying to predict.
A correct backtesting profile is reveal-safe: it only counts volume up to the current replay bar and grows as you play forward. Scrub back, and it shrinks again. At every moment, you're reading a profile made only of information you'd actually have had live. If your tool draws the full-range profile instantly regardless of where the playhead sits, every level you test is contaminated with hindsight.
These two traps are why a purpose-built replay backtester matters more than bolting a live indicator onto a replay. Both are handled correctly in the TradingSFX backtester: the fixed range profile is binned from your imported base bars, so it stays sharp on any timeframe, and it only counts revealed candles, so it grows honestly as you play forward.
The Step-by-Step Workflow
Here's the loop, assuming you're in a bar-replay backtester with a fixed range volume profile tool.
1. Load your data and write your rules
Import your candle data (any market, any broker CSV export) and write down the exact setup you're testing before the first candle plays: entry trigger, stop, target, and the volume-profile condition you want to test, for example "only take the setup when it fires within the value area" or "only when entry is above the POC."
2. Mark the range that builds the level
Draw the fixed range profile over the window whose levels you care about: the prior session, the overnight range, the consolidation before the move. The profile appears, showing the POC, value area, and the high and low volume nodes for that window.
3. Read the level, then hide the future
Note where the POC and value area edges sit. Now play the chart forward candle by candle, with everything after the current bar hidden. Watch price approach the levels you marked. Because the profile is reveal-safe, it keeps building as new candles print, exactly as it would live.
4. Take the trade by your rules
When your setup fires, take it, but only if it meets the volume-profile condition you wrote down. Fade the failed push above the VAH back to POC, or enter the value-area breakout, or whatever you're testing. Log entry, stop, exit, direction, and, critically, where the entry sat relative to the profile (at POC, above VAH, in an LVN, etc.).
5. Segment the results
After 50 to 100 logged trades, don't just look at the overall win rate. Split it by the profile condition:
- Do entries near the POC win more than entries in dead space?
- Do value-area-edge fades beat value-area-breakout entries, or the reverse?
- Are your losers clustered in a particular zone?
That segmentation is the whole point. It turns "volume profile feels useful" into "entries within the value area lifted my win rate by X and the breakout version didn't," which is something you can actually act on. The backtesting with a trading journal guide covers how to structure sessions and confluence analysis so this segmentation is built into the log rather than a spreadsheet chore afterward.
A Note on Forex Volume
If you're testing on forex data, remember the profile is built from tick volume, not real exchange volume, because forex has no central book. The shape and the levels are reliable (tick volume tracks activity closely), but the absolute numbers are a proxy and vary between brokers. On crypto and futures data you get real volume. Full detail on that distinction is in volume profile explained. It doesn't change the workflow above; it just keeps your expectations honest.
Sample Size and Honesty
The usual backtesting discipline still applies, and volume profile doesn't exempt you from it:
- Aim for 100+ trades before trusting the segmentation. Twenty trades split across three profile conditions is noise cubed.
- Start from random dates you don't remember, so you're not replaying a move you already know the outcome of.
- Log the losers, especially the ones that looked like clean POC bounces and failed. Those are the trades that tell you where the level doesn't hold.
- Treat replay numbers as an upper bound. Idealized fills and no real money mean live results tend to be a step worse.
Putting It Together
Volume profile in backtesting isn't about adding another indicator to the chart. It's about answering a specific question, "does entering near these volume levels actually improve my setup?", with data instead of belief. Fixed range gives you a level that holds still, base-bar binning keeps it sharp, reveal-safe drawing keeps it honest, and segmented logging turns the whole thing into an edge you can measure.
The fastest way to feel the difference is to run one session. The TradingSFX backtester demo is free and needs no signup: load a chart, draw a fixed range volume profile, and step through the candles to watch price react to the POC and value area in real time. When you want to test your own markets, the full backtester is on every plan, including the free one, and loads your own data for any symbol. Keeping the results is the Pro line: on Pro every practice trade logs straight into your journal.
FAQ
Why use fixed range volume profile for backtesting?
Because it stays anchored to the window you mark. The POC and value area you find don't move as you scroll or play the chart forward, so you can watch, uninterrupted, whether price respects a specific level, which is exactly what a backtest is meant to measure.
Will the profile stay accurate if I switch timeframes?
Only if it bins from your imported base data rather than the display candles. Base-bar binning stays sharp on any timeframe; display-candle binning gets blurry as you zoom out. Import 1-minute data and check whether the profile still looks sharp on the 1-hour chart, that's the tell.
What is the future-leak trap?
A profile that counts volume from candles you haven't revealed yet is built partly from the future, which makes your backtested entries look better than they were. A correct replay profile is reveal-safe: it only counts revealed candles and grows as you play forward.
Do I need to code to do this?
No. You draw the profile by marking two points, read the levels, and log trades by hand. Coding is only for automated backtesting, which tests scripted rules rather than your own decisions.
How many trades do I need?
At least 100 before trusting the segmentation by profile zone. Splitting a small sample across several conditions produces noise, not signal.
Test the level before the market tests you.
Turn your trades into a real edge
Stop guessing what works. Log your trades, track confluences, and let the AI Coach surface the patterns you keep missing across every prop firm rule and strategy.
No credit card required · Start for free