Volume Profile Explained (2026): How to Read POC and Value Area
What volume profile is, how to read the point of control (POC), value area high and low, and high/low volume nodes, how traders use it for entries, and the tick-volume caveat every forex trader should know.
Table of contents
- 01What Is Volume Profile?
- 02Volume Profile vs Traditional Volume
- 03The Four Things Every Profile Shows You
- 04How to Read a Volume Profile
- 05Fixed Range, Visible Range, and Session Profiles
- 06How Traders Use Volume Profile
- 07The Forex Caveat: Tick Volume vs Real Volume
- 08How to Practice Reading Volume Profile
- 09FAQ
- 10See It on Real Charts
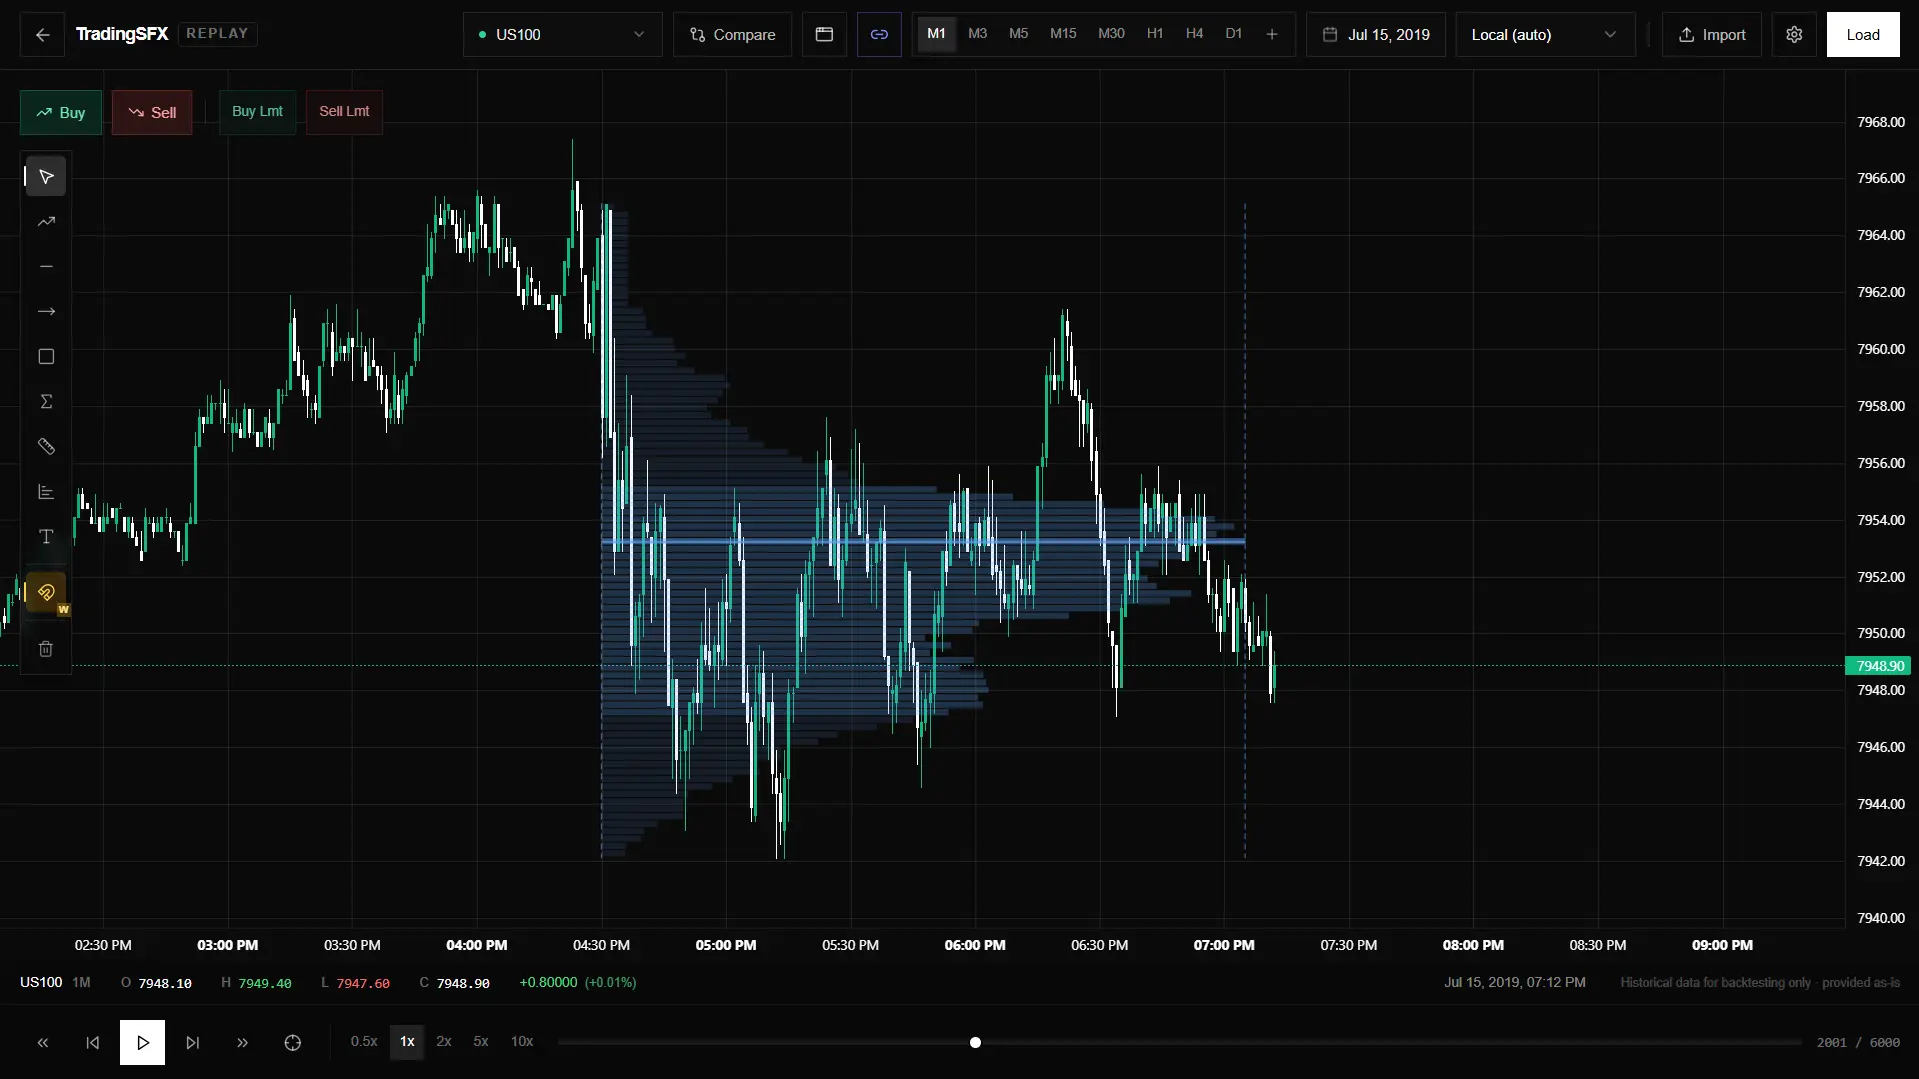
Volume profile turns the one thing most charts throw away, where volume actually traded, into a map of the levels that matter. Instead of a row of bars along the bottom of the screen telling you how much traded in each minute, it draws a horizontal histogram down the side of the chart telling you how much traded at each price.
That single change answers a different question. Standard volume tells you when the market was busy. Volume profile tells you where the market did business, which prices buyers and sellers kept coming back to, and which prices they passed through and never looked at again.
This guide covers what a profile is made of, how to read the point of control and value area, what high and low volume nodes signal, the honest limits of volume data on forex, and how to practice reading profiles without risking money.
What Is Volume Profile?
A volume profile is a histogram of traded volume plotted against price rather than time. For a chosen range of candles, the tool slices the price axis into rows (called bins or buckets) and adds up how much volume traded inside each row. Rows where a lot traded stick out to the side; rows where little traded stay short.
The result looks like a sideways mountain range pinned to your chart. The widest part is the price the market spent the most effort trading. The thin parts are prices the market rejected quickly.
This matters because markets are auctions. Price moves until it finds a level where buyers and sellers disagree enough to transact in size, then it lingers there while that business gets done. Those lingering levels are where the real decisions happen, and they are exactly what a profile makes visible.
Volume Profile vs Traditional Volume
Both use the same underlying data. They organize it along different axes, and that changes what you can see.
| Traditional volume | Volume profile | |
|---|---|---|
| Plotted against | Time (per candle) | Price (per level) |
| Answers | When was the market active? | Where did the market trade most? |
| Shows | Spikes on news, session opens | Support/resistance from real activity |
| Best for | Confirming momentum on a move | Finding levels before the move |
Traditional volume is reactive: it confirms a breakout after the candle prints. Volume profile is anticipatory: it shows you the levels likely to matter before price gets there, because those levels were built by real trading in the past.
The Four Things Every Profile Shows You
Once you can name the parts of a profile, reading one becomes straightforward.
1. Point of Control (POC)
The point of control is the single price level with the most traded volume in the range, the widest row in the histogram. It represents the price the auction agreed on for the longest, the "fairest" price of the period.
The POC tends to act as a magnet. When price drifts away and then returns, the POC is often where it stalls, reverses, or decides its next direction. A POC from a previous session that price has not revisited (a "naked" POC) is a common target, because unfinished business tends to get retested.
If this is the part you care about most, our point of control deep dive covers naked and developing POCs, POC migration, POC vs VWAP, and how traders actually trade the level.
2. Value Area (VAH and VAL)
The value area is the band of prices containing a set share of the total volume, 70% by default, which is roughly one standard deviation around the POC. Its edges have names:
- VAH (Value Area High): the top of the value area.
- VAL (Value Area Low): the bottom of the value area.
Price inside the value area is considered fair. Price above the VAH or below the VAL is considered an extreme, and one of two things usually happens: the market rejects the extreme and snaps back toward value, or it accepts the new prices and builds a fresh value area higher or lower. Watching how price behaves at the VAH and VAL is one of the most reliable reads a profile gives you.
3. High Volume Nodes (HVN)
A high volume node is any fat part of the profile, a price where lots of volume traded. HVNs are areas of acceptance. Price moves slowly through them because there is plenty of willingness to trade on both sides. They frequently act as support and resistance, and price tends to consolidate when it reaches one.
4. Low Volume Nodes (LVN)
A low volume node is a thin part of the profile, a price the market passed through quickly and did little business at. LVNs are areas of rejection. Because there was little interest there, price tends to move through them fast when it returns, which makes them useful for spotting where a move might accelerate, and where it is unlikely to find a resting place.
How to Read a Volume Profile
Put those four pieces together and a profile tells a story:
- The POC and value area define "fair." As long as price is inside the value area, the market is balanced. Range strategies live here.
- The VAH and VAL are the decision points. A push outside that either fails (fade back to POC) or holds (breakout to a new range). Watching the reaction at the edge is the trade.
- LVNs are the highways, HVNs are the traffic jams. Expect fast travel through thin zones and slow grinding through thick ones.
- Shape tells you about balance. A profile with one clear POC in the middle (a "D-shape") is a balanced, ranging market. A profile with volume stacked at the top or bottom (a "P" or "b" shape) shows a trend that found value at one end.
None of this predicts the future. It describes where the market has already committed capital, which is a far more solid foundation than a line drawn between two random swing points.
Fixed Range, Visible Range, and Session Profiles
Volume profile comes in a few flavors, and picking the right one matters:
- Fixed Range Volume Profile (FRVP): you mark a start and end point, and the profile is built from exactly that window. It stays anchored as you scroll, which makes it the right tool for studying one specific session, swing, or consolidation. TradingView documents its own fixed range volume profile tool if you want to see the concept on their platform.
- Visible Range Volume Profile (VRVP): rebuilds from whatever candles are on screen. It updates every time you pan or zoom, which is handy for a quick read but useless for marking a level you want to keep.
- Session / Periodic Profiles: one profile per day, week, or session, drawn automatically. Good for spotting where each day built value.
For deliberate analysis and backtesting, fixed range is usually the one you want, because the level you find stays exactly where you put it.
How Traders Use Volume Profile
A few common approaches, framed as concepts rather than guarantees:
- POC as a magnet and pivot. Fade moves back toward the POC when the market is balanced; watch for reversals when price reaches it.
- Value area edges for mean reversion. In a range, the VAH and VAL are where fades set up: sell the failed push above VAH, buy the failed push below VAL, targeting the POC.
- Value area breakout for trend entries. When price accepts prices outside the value area (holds there instead of snapping back), that acceptance can mark the start of a trend into fresh territory.
- LVNs as entry and target zones. A thin node is a place price is unlikely to rest, so it can be a good spot to place a target beyond, or a level where a stop is less likely to get slowly bled.
- Naked POCs as targets. An untouched POC from a prior session is unfinished business the market often revisits.
The point is that every one of these levels is built from actual traded volume, not a subjective line. That is what makes volume profile worth learning.
The Forex Caveat: Tick Volume vs Real Volume
Here is the part most tutorials skip, and it matters.
Forex is decentralized. There is no central exchange consolidating every trade, so no broker actually knows the total volume traded on a pair — that number does not exist. What forex platforms show instead is tick volume: the number of price updates in each period, not the number of contracts or lots.
That has two consequences for volume profile on forex:
- The shape is still useful. Studies have found tick volume correlates closely with real activity, because busy periods produce more price updates. So a profile built from tick volume reliably shows where the market was active, which is what you actually use it for.
- The absolute numbers are a proxy, and they vary by broker. One tick can be a one-lot trade or a thousand-lot trade, and different brokers use different liquidity feeds, so two brokers' profiles for the same pair won't match exactly.
Real, exchange-reported volume only exists on centralized markets, crypto (from an exchange like Binance) and futures. If you trade those, your profile is built on true volume. If you trade forex, treat the profile as a high-quality map of activity, not a precise count of contracts. Used that way, it is genuinely valuable. Sold as institutional order flow, it is overselling what the data can do.
How to Practice Reading Volume Profile
Reading a profile is a skill, and like any skill it comes from reps, not from reading about it. The problem is that reps on live charts are slow and expensive: you might see a handful of clean setups a week.
Bar-replay backtesting fixes that. You load historical data, play it forward candle by candle, drop a fixed range profile over a session, and watch how price actually behaved around the POC and value area, over and over, in a fraction of the time. Because the future is hidden, you learn to read the profile before you know the outcome, which is the only version of the skill that transfers to live trading.
Our fixed range volume profile in backtesting guide walks through that workflow step by step, and the broader bar replay backtesting guide covers how to run replay sessions without letting hindsight bias creep in.
FAQ
What is the point of control (POC)?
The POC is the price level where the most volume traded over the range you selected. It marks the fairest price of the period, the level buyers and sellers agreed on longest, and it often acts as a magnet and a pivot when price returns to it.
What is the value area?
The value area is the price band containing 70% of the range's volume (about one standard deviation). Its top is the VAH and its bottom is the VAL. Inside it, price is "fair"; outside it, price is at an extreme that tends to either reverse back to value or hold and build a new range.
Does volume profile work on forex?
Yes, with a caveat. Forex profiles are built from tick volume, not real exchange volume, because forex has no central book. Tick volume correlates well with real activity, so the shape and the levels are reliable, but the absolute numbers are a proxy and differ between brokers.
What is the difference between fixed range and visible range volume profile?
Fixed range is built from a specific window you mark and stays anchored as you scroll. Visible range rebuilds from whatever is currently on screen and changes as you pan or zoom. Use fixed range to study a specific session; use visible range for a quick read of the current view.
How do I practice using volume profile?
The fastest way is bar-replay backtesting: load historical data, play it forward candle by candle, draw a fixed range profile over each session, and read the POC and value area before you know the outcome. You can try it free in the demo backtester, no signup needed.
See It on Real Charts
The quickest way for volume profile to click is to draw one yourself and watch price react to the levels. The TradingSFX backtester demo is free and needs no signup: load a chart, drop a fixed range volume profile over a session, and step through the candles to see how price behaved around the POC and value area.
When you're ready to test it on your own markets, the backtester on every plan, including the free one, lets you load your own data for any symbol and timeframe. On Pro every practice trade lands in the same journal and analytics you use for live trading.
Learn where the market did business, and the levels stop being guesses.
Turn your trades into a real edge
Stop guessing what works. Log your trades, track confluences, and let the AI Coach surface the patterns you keep missing across every prop firm rule and strategy.
No credit card required · Start for free